Lab 6: Iterators and Art
This lab explores iterators, generators and direction-based visualizations. Our goal will be to produce images similar to those generated by Nadieh Bremer for π but for arbitrary irrational numbers. Our focus will be on
Here are some example images for


Step 0: Lab Preparation
- The end of this Washington Post article shows two visualizations of π by Nadieh Bremer. Please read about these visualizations in detail on her blog.
- Please review Lectures 18 and 19
Step 1: Source Code
- Clone your private repo to an appropriate directory in your home folder
(
~/labsis a good choice):$ git clone git@github.com:williams-cs/<git-username>-cs135-lab6.git
Remember, you can always get the repo address by using the ssh copy-to-clipboard link on github. - Once inside your <git-username>-cs135-lab6 directory, create a virtual environment using
$ virtualenv --system-site-packages -p python3 venv
The --system-site-packages will let us use the matplotlib package. - Activate your environment by typing:
$ . venv/bin/activate
- Use pip to install the pillows imaging library:
$ pip install pillow
- Use pip to install the scipy:
$ pip install scipy
- Remember that you must always activate your virtual environment when opening a new terminal
- Type
$ git branch
and notice that you are currently editing the master branch. - Create a new branch with
$ git branch iterate
- Checkout this branch by typing
$ git checkout iterate
- Any changes you make to the repository are now isolated on this branch.
Step 2: An Iterator for e
In the file called iterators.py, write a generator called e_iterator with a single parameter, which is the number of digits of
  >>> from iterators import e_iterator
  >>> [x for x in e_iterator(10)]
  [2, 7, 1, 8, 2, 8, 1, 8, 2, 8]
  >>>
Step 3: An Iterator for points
In the same file iterators.py, write a generator called to_points(iterator, distinct_values) that has two parameters:
- iterator: some iterator that produces values in the range
[0..N-1] ; and - distinct_values: the number
N corresponding to the number of distinct values in the range.
This iterator should, starting at (0,0), produce a new point of length 1 away from the previous point in the direction corresponding to the digit. The directions should start at 0 (corresponding to an angle of
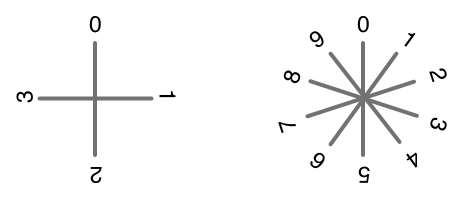
There is one subtle difference between how we and Bremer associate points with digits. Bremer associates her first point with her first digit (3 corresponds to (0.0) in her π example) while we associate our first point with the step relative to (0,0) (2 corresponds to (0.95,0.33)). I perfer this because the visualization does not lose any information whereas associating the first digit with (0,0) means you can never recover the first digit from the image. Test your code in the REPL:
  >>> from iterators import e_iterator, to_points
  >>> [x for x in to_points(e_iterator(3),10)]
  [(0.9510565162951535, 0.3090169943749474), (0.0, -1.1102230246251565e-16), (0.5877852522924732, 0.8090169943749472)]
Step 4: VizImage Base Class
In viz.py you will find code stubs for a VizImage class. This class takes care of extracting a bounding box around the points in points, interpolating a point in the bounding box to a point in an image of dimensions width × height, creating and saving an image of appropriate dimensions, and drawing the path corresponding to points onto the image.
  class VizImage:

      def __init__(self, points, width, height):

      def _interpolate(self, point):

      def _draw(self, im):

      def draw(self, filename):
          im = Image.new("RGB", (self._width, self._height), getrgb("WHITE"))
          self._draw(im)
          im.save(filename, "PNG")
Some implementation notes:
- Your __init__ method should store four values corresponding to the minimum and maximum of the x and y coordinates of the bounding box as instance variables. You can use the builtin function
minalong with the optional key argument. This argument should probably take an itemgetter. - The _draw method should, starting with (0,0) draw black lines of width 5 on the image corresponding to the points passed to __init__. This method will be overwritten in subsequent classes that inherit from VizImage.
- Make show that you use the
underscore convention for private member variables and functions. - Remember that the Y-axis of the image runs top-to-bottom but the Y-axis of the points runs bottom-to-top.
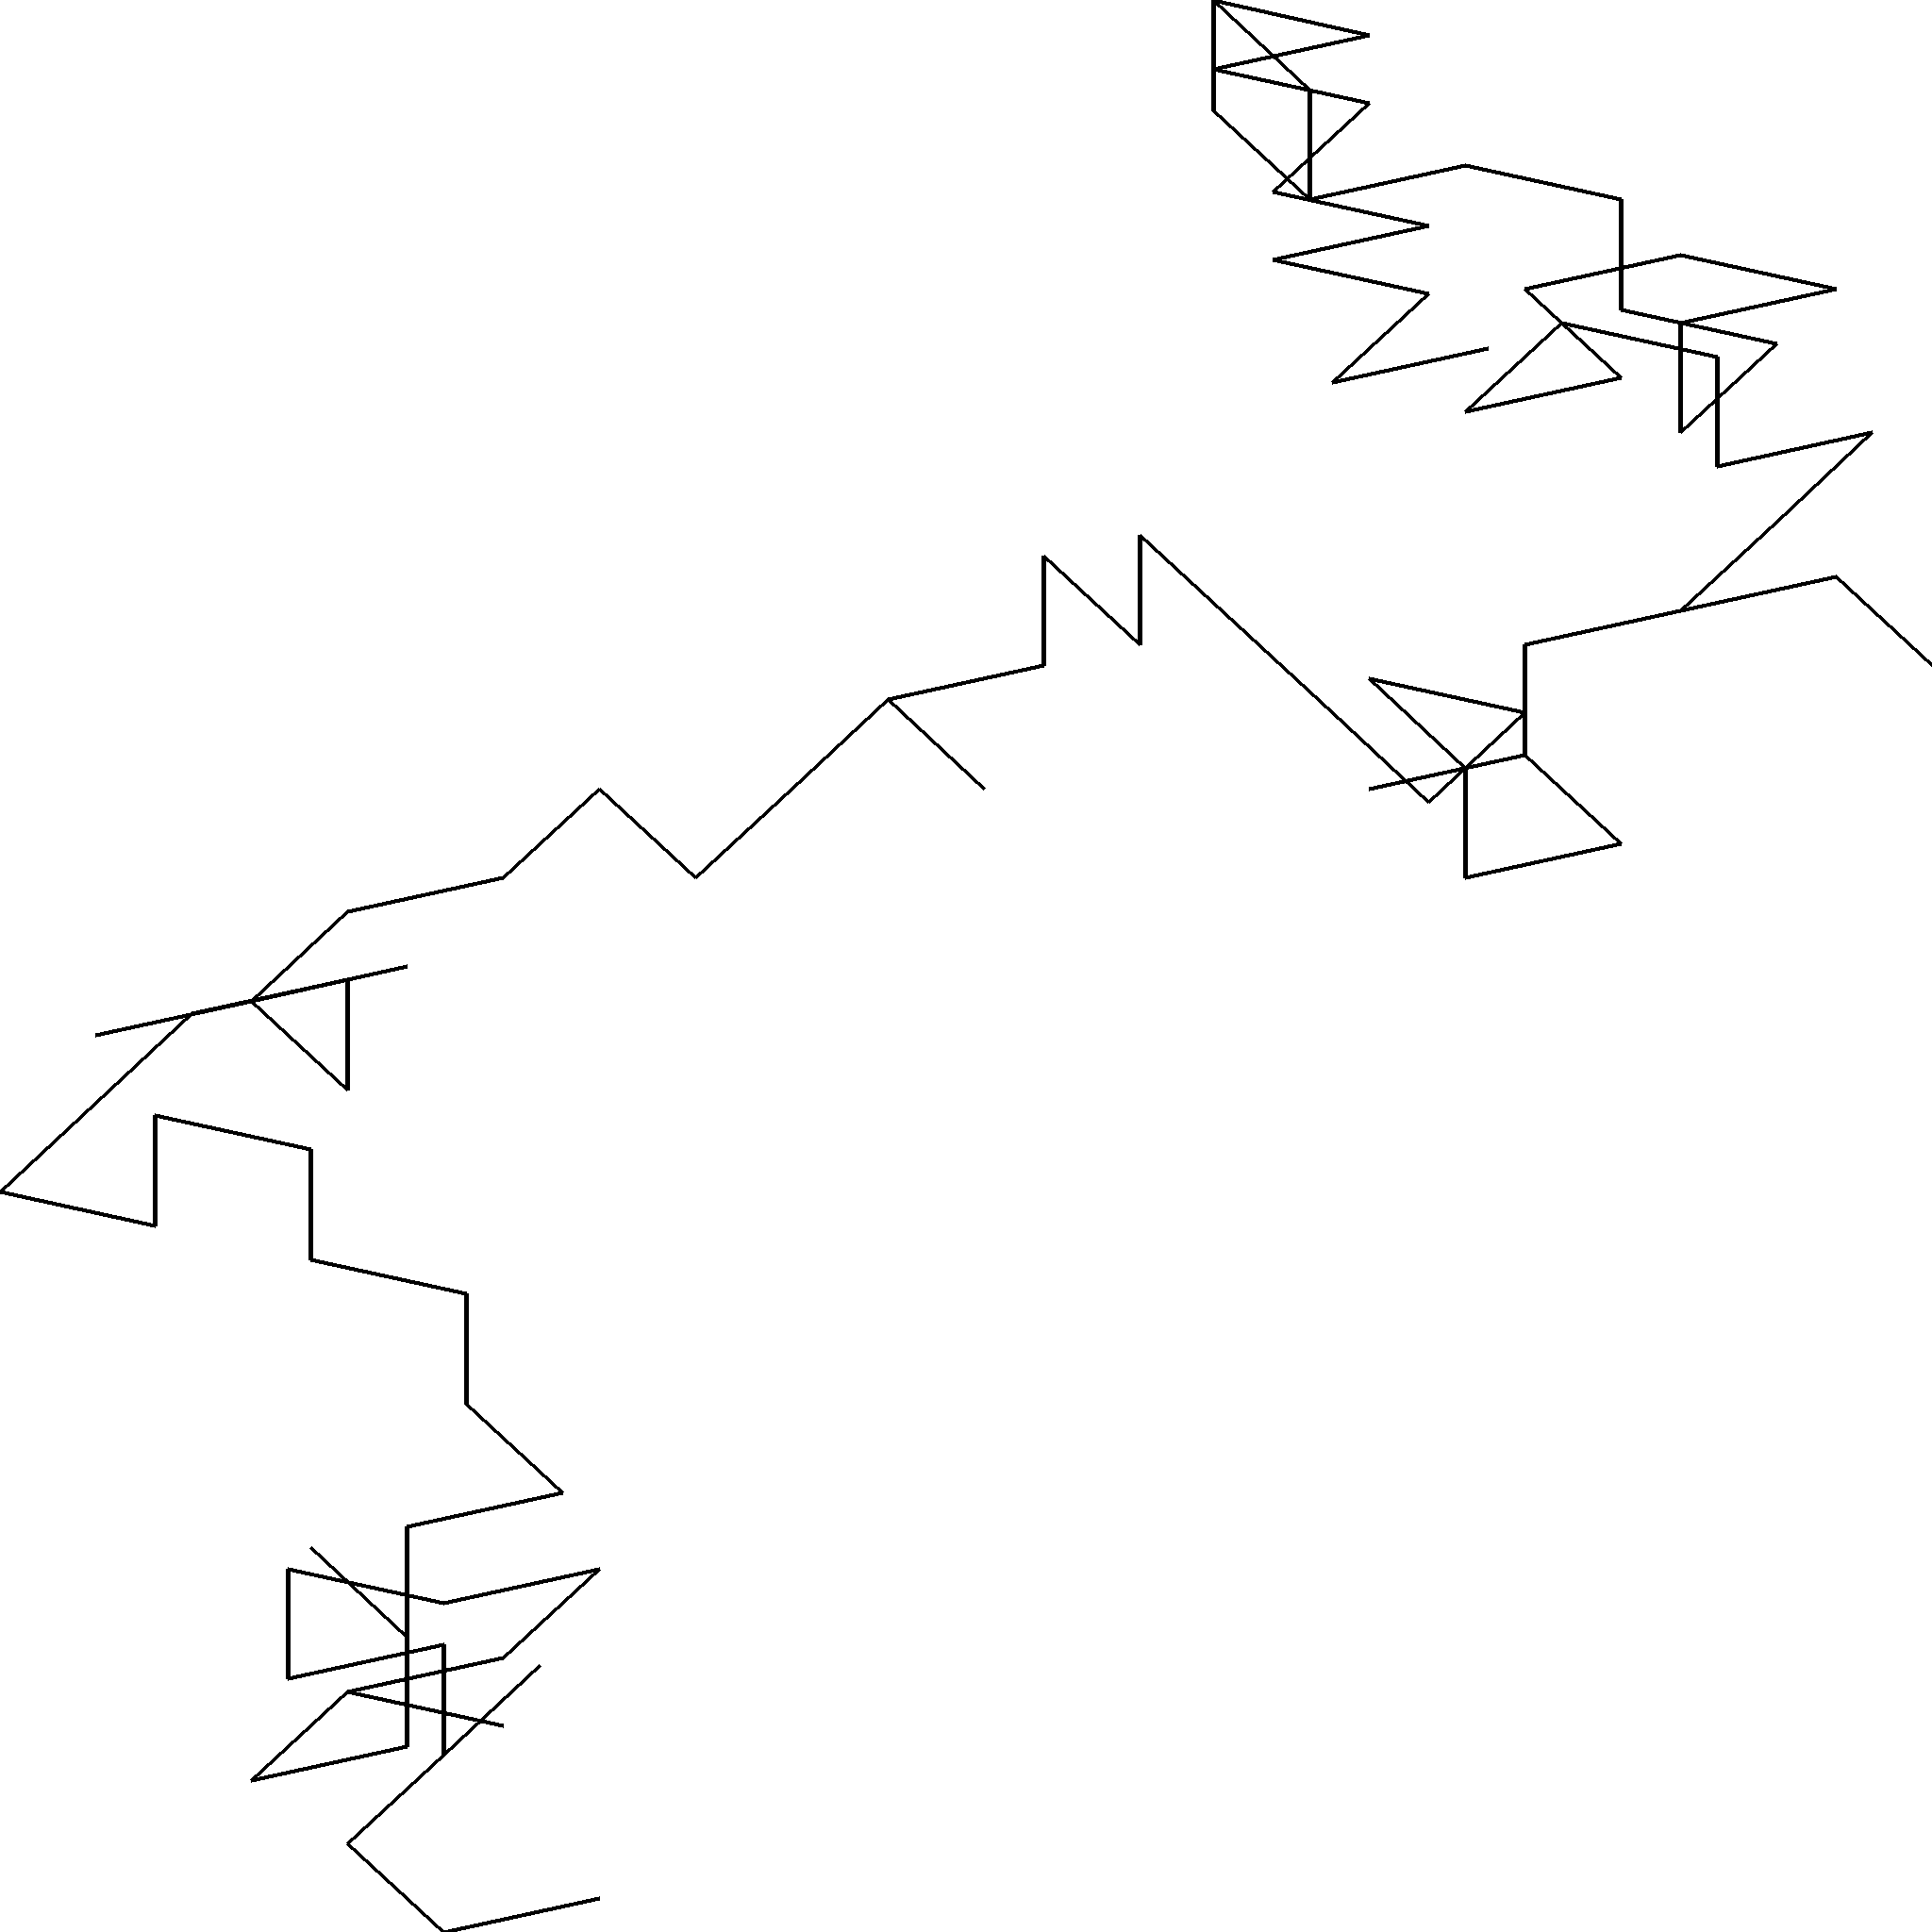
  >>> viz = VizImage([x for x in to_points(e_iterator(100),10)], 2048,2048)
  >>> viz.draw("e100.png")
should produce the following image
Step 5: DirectionVizImage Subclass
You should define a class called DirectionVizImage that is similar to VizImage except that it requires an additioonal list parameter directions, which is identical in length to points and corresponds to the compass direction of each point relative to the previous point.
The class also makes use of color ranges, provided for you in color.py. This package provides one function called color(n) that returns a list of n colors in the same dark rainbox range used by Nadieh Bremer.
  class DirectionVizImage(VizImage):

    def __init__(self, points, directions, n, width, height):
        super().__init__(points, width, height)
        self._directions = directions
        self._colors = colors(n)

    def _draw(self, im):
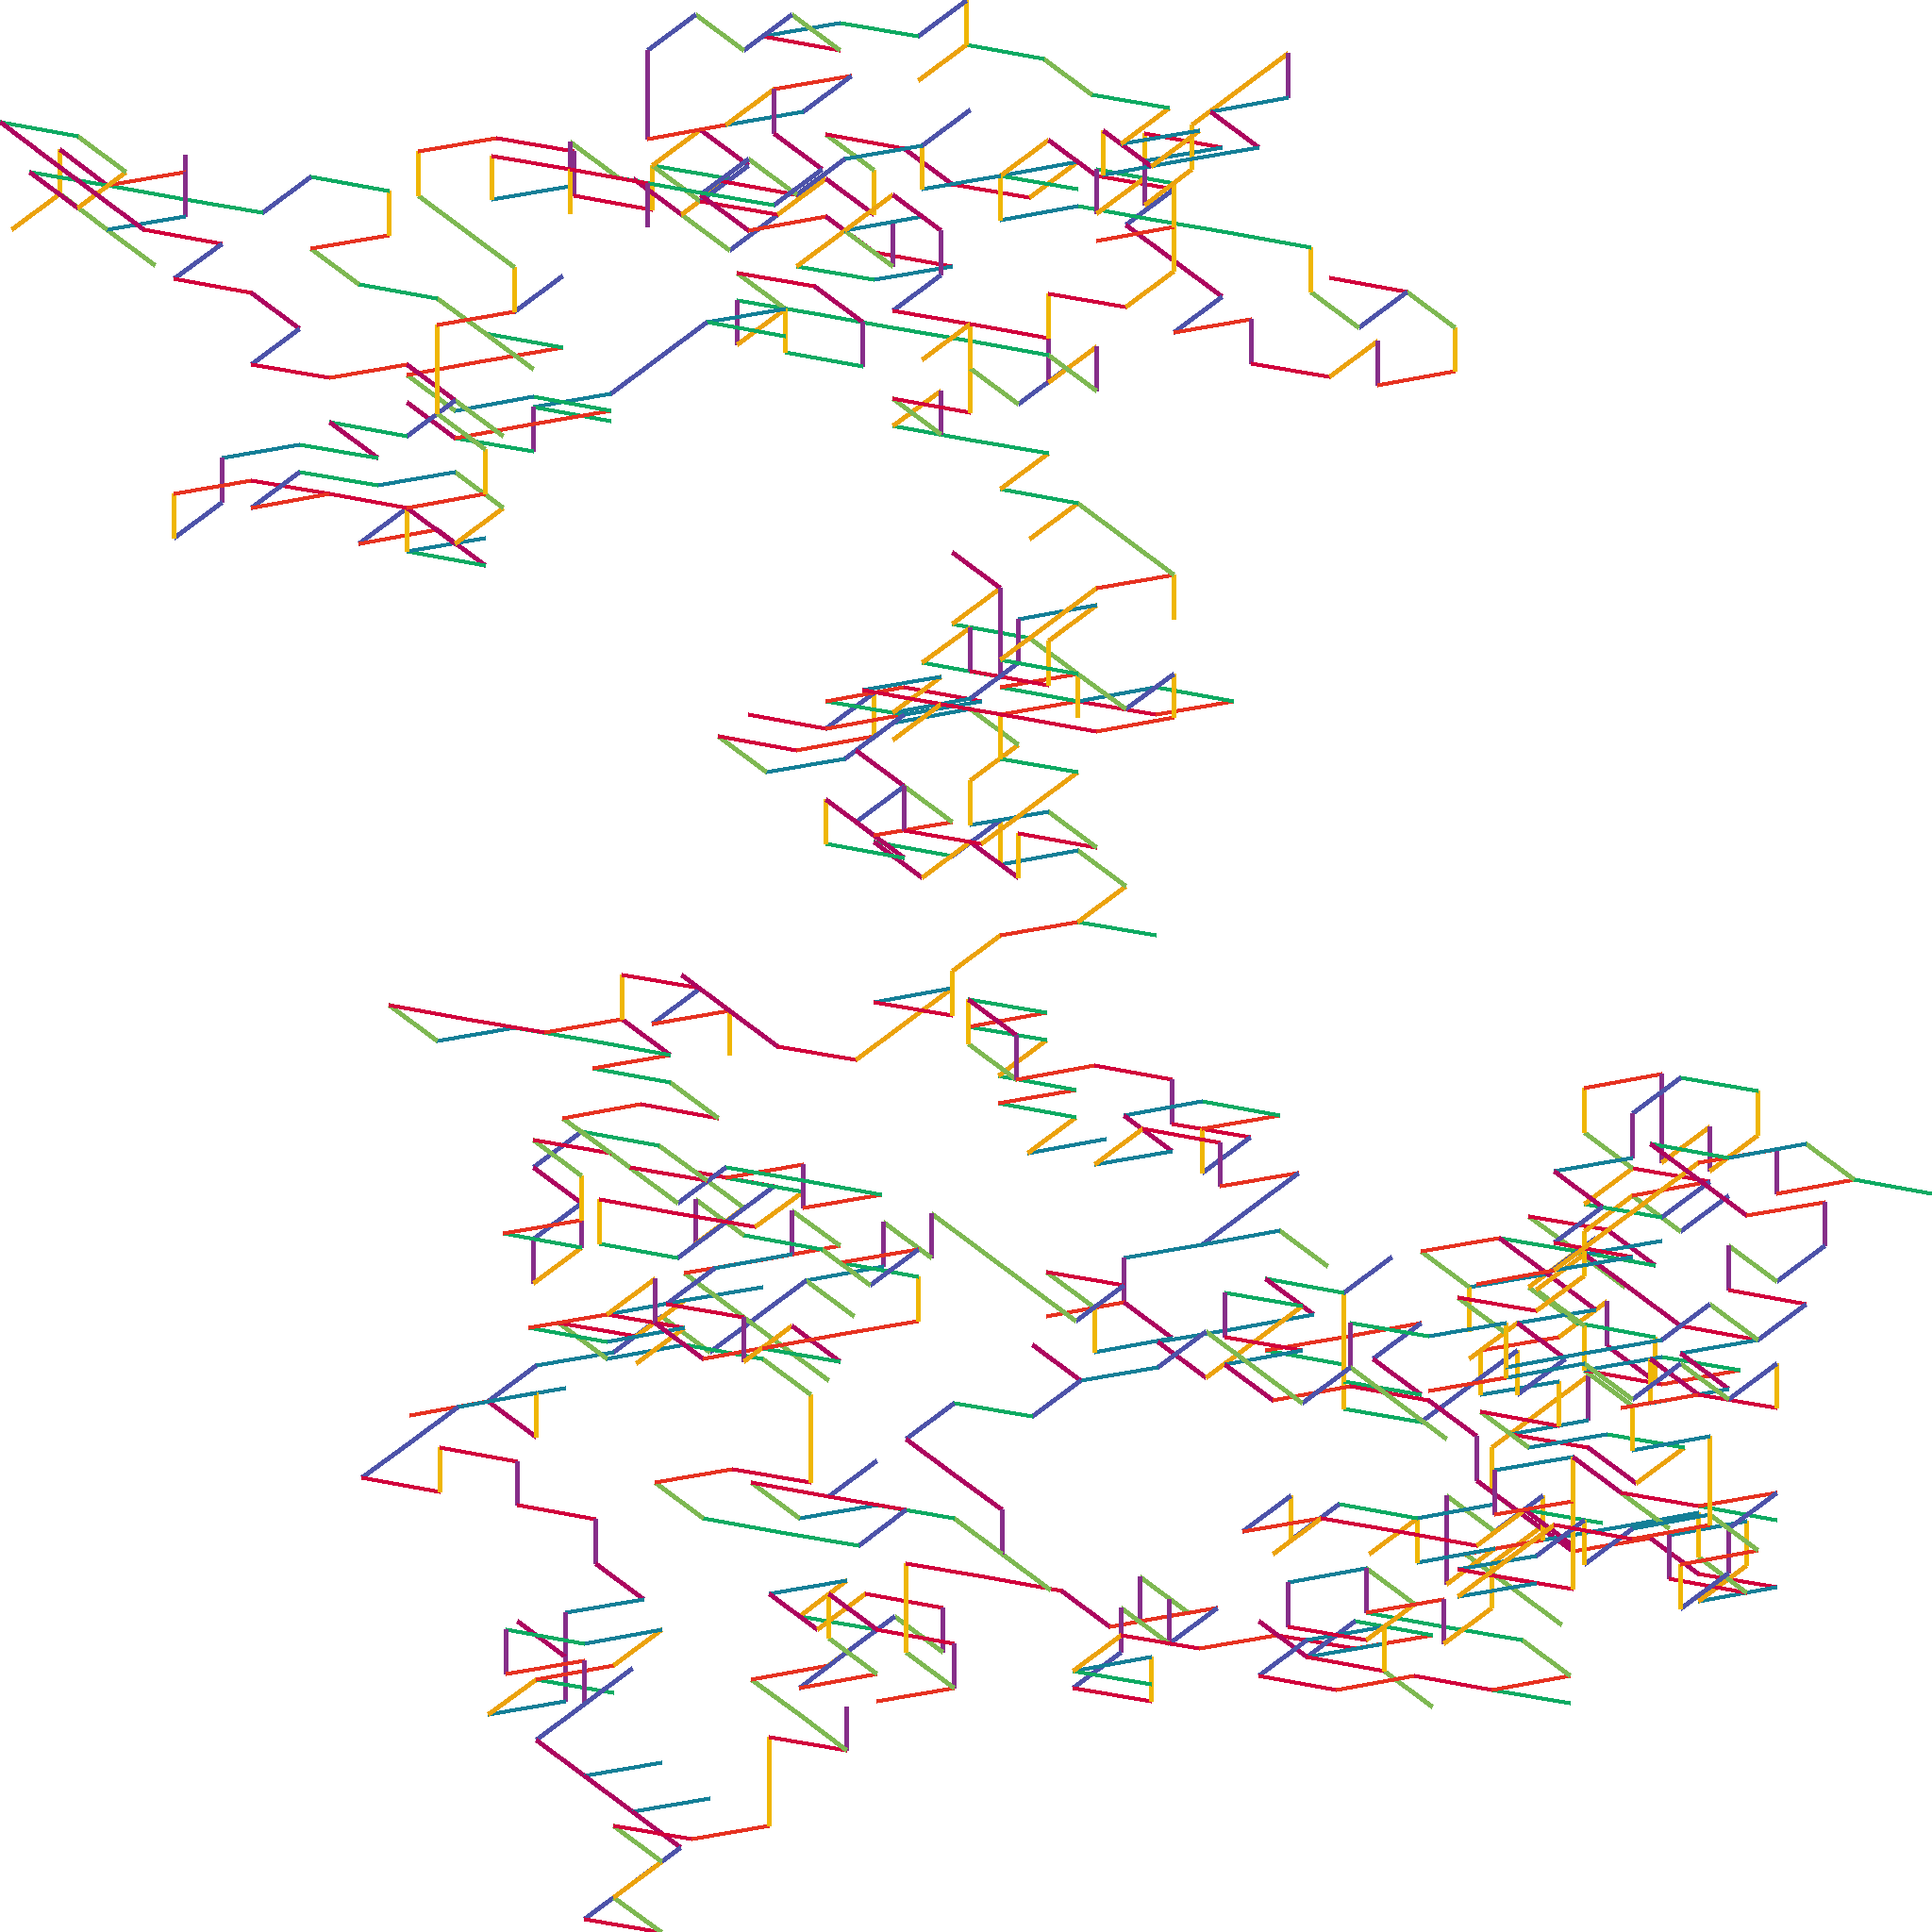
Creatiing an instance of DirectionVizImage in the REPL and saving the output to a file
  d = DirectionVizImage([x for x in to_points(e_iterator(1000),10)],
                        [digit for digit in e_iterator(1000)],
                        10, 2048, 2048)
  d.draw('e1000.png')
should produce the following image.
Step 6: LengthVizImage Subclass
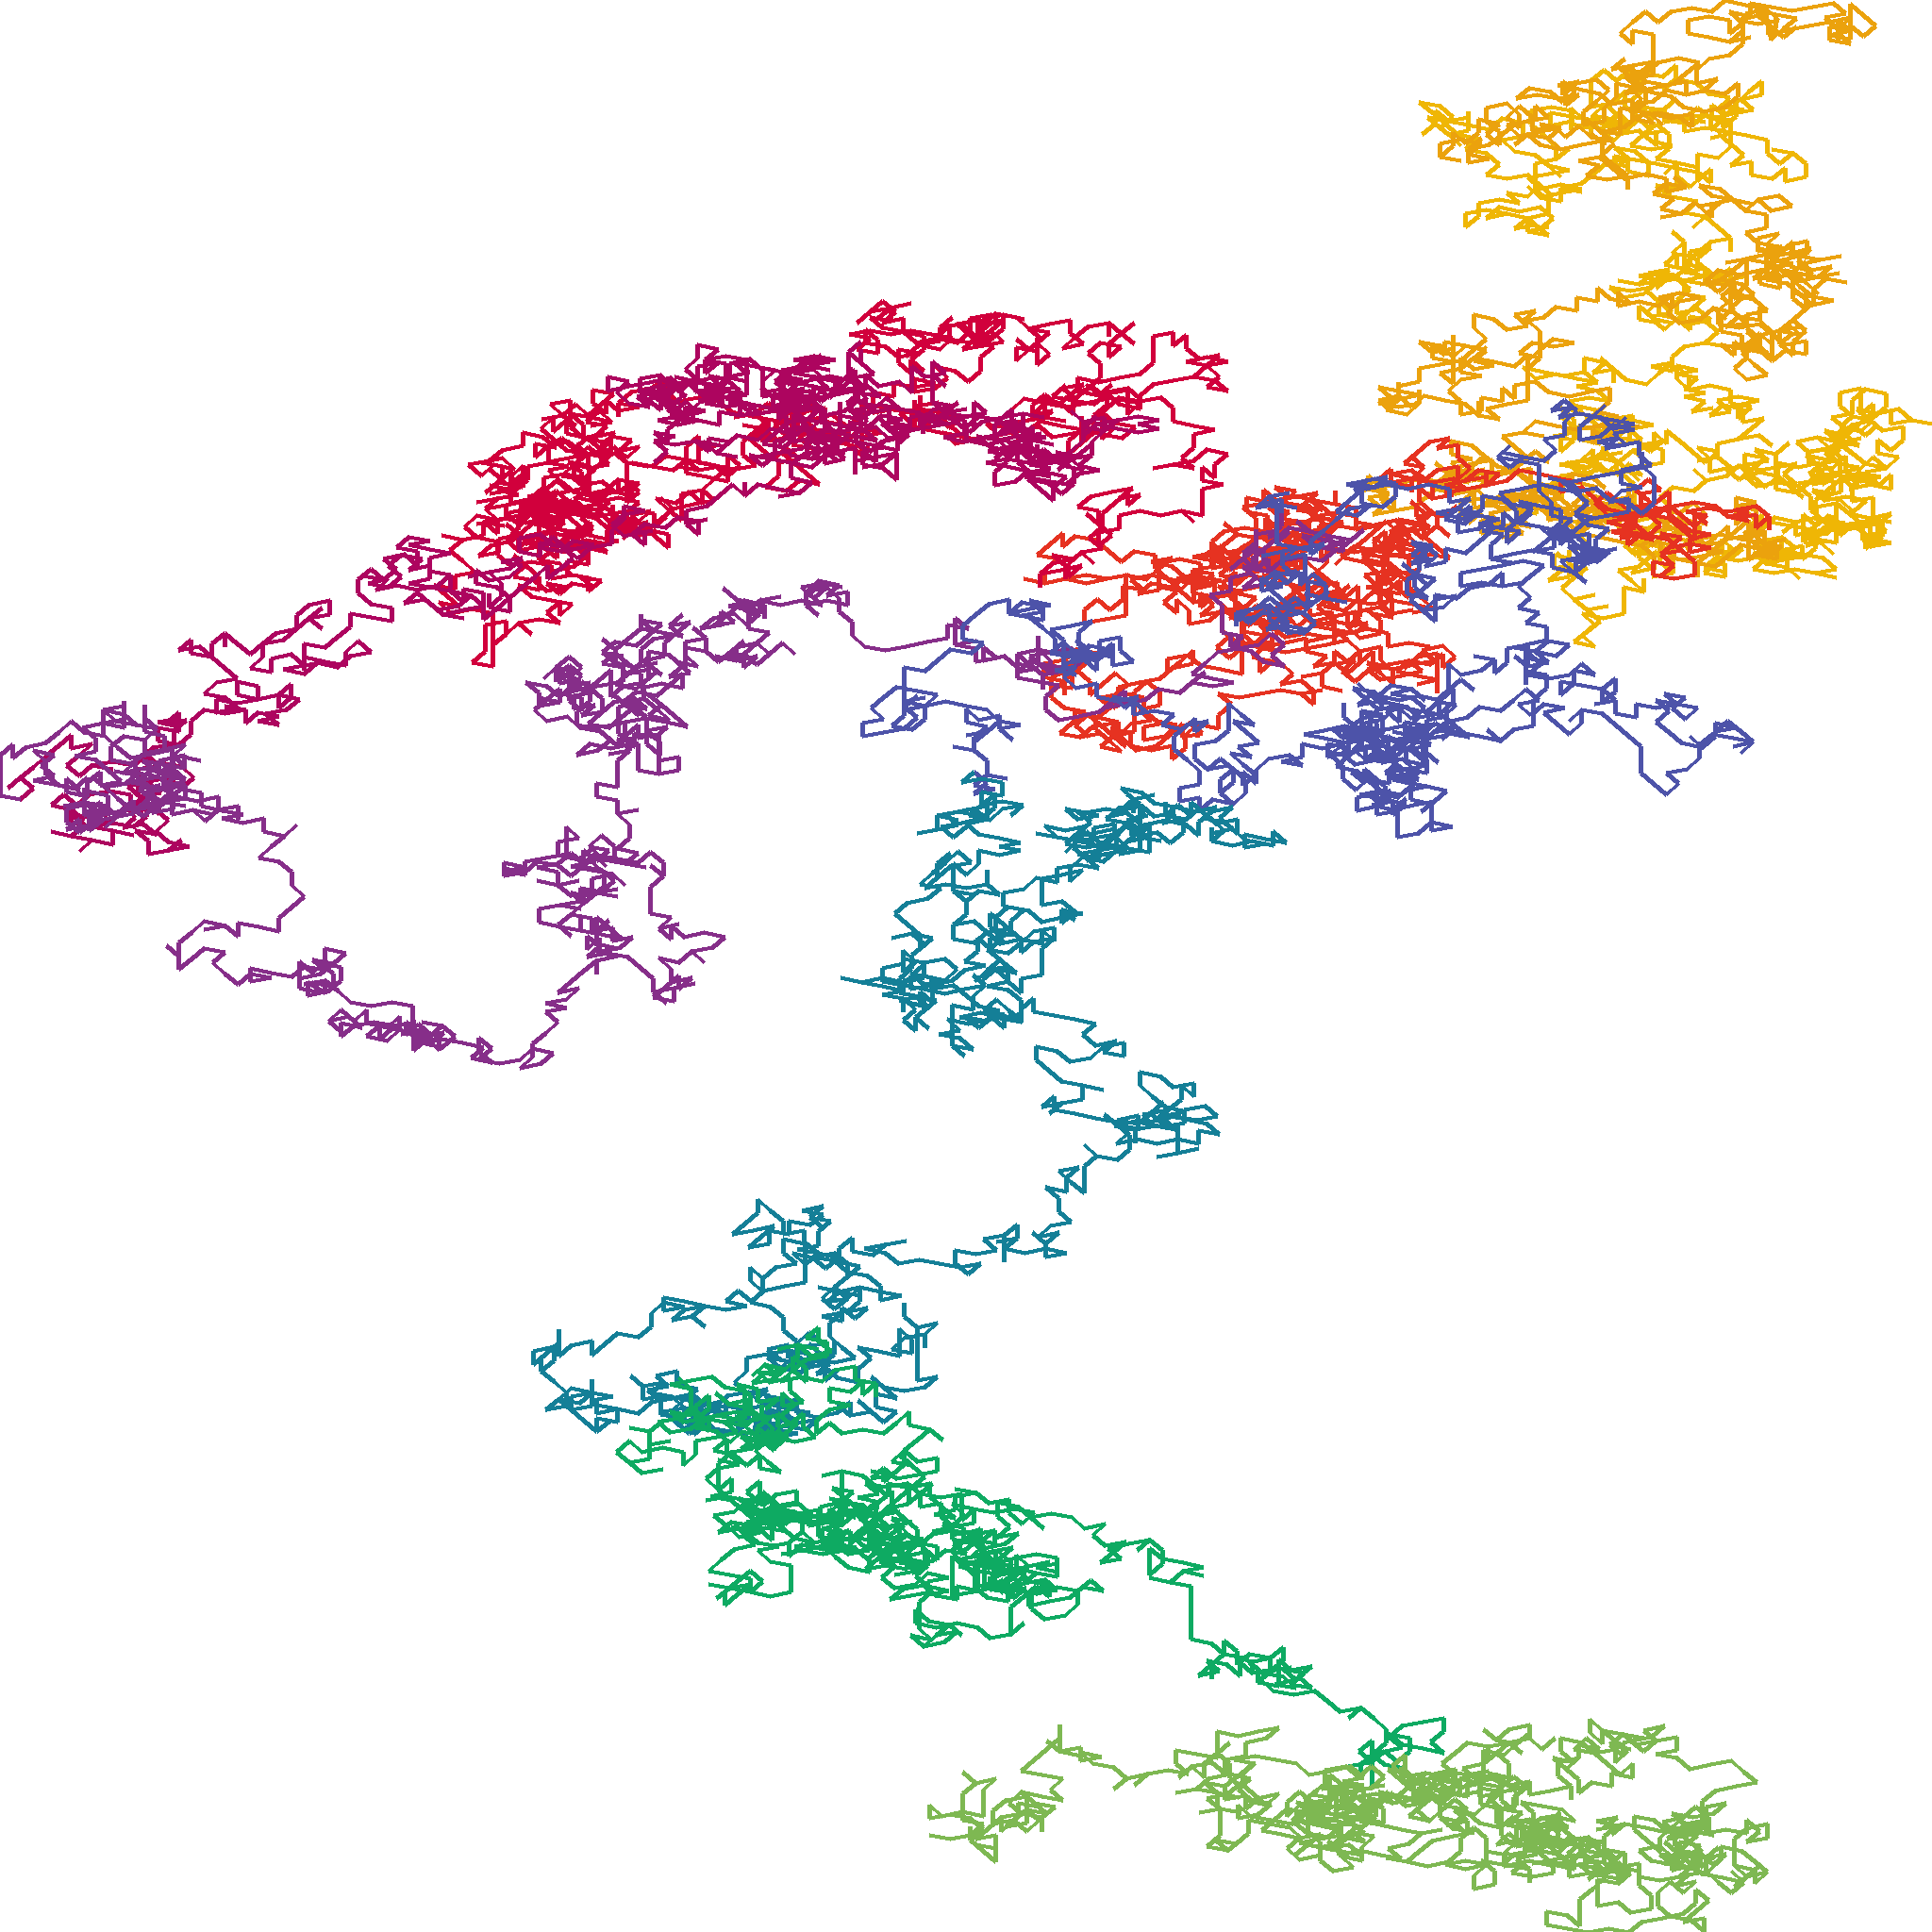
You should implement a class called LengthVizImage, which inherits from VizImage. Creating an instance of this class requires three arguments: points, width, and height.
Your implementation should use 10 colors to draw the lines, changing to the next color after processing an additioanl 10% of the lines. Here is what your image should look like for the first 10000 digits of e
Step 7: Submission
- Now commit those additions to the repository:
$ git commit -a -m "some log message"
- Push your changes back to github repo:
$ git push
You will probably be asked to type$ git push --set-upstream origin iteratewhich you should do. This pushes your iterator branch back up to the GitHub Repo. - Now navigate to your GitHub repo using a web browser. You should see a list of recently pushed branches with links to compare and pull request. Go ahead and issue a PR