Lab 4: Stock Viz
This lab explores visualizing stock data by market cap and percentage changes over small spans of time. The data comes from yahoo finance and is downloaded in CSV format. We will use a dynamic programming algorithm by [BBRR] to partition a square into p rectangles so that the sum of the perimeters of the rectangles is minimized when those rectangles appear in contiguous column
Beautiful visualizations of stock market data are available around the web. One such visualzation (available at Market Watch) shows stocks as rectangles where the size of the rectangle is proportional to the market cap and the color of the rectangle is proportional to its performance.
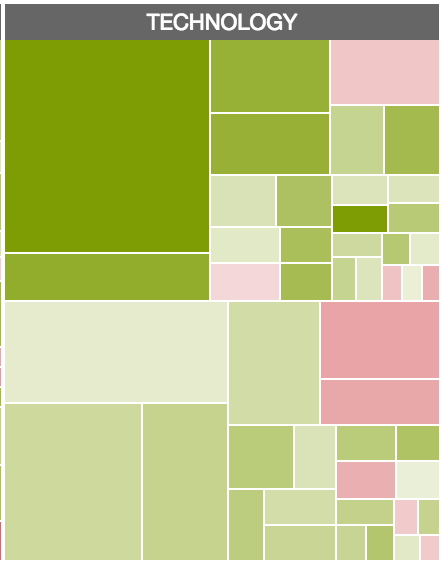
This visualization is based on a tree. It produces a nice tiling, but stocks with similar market share may be far away. A related visuatlization that groups stocks with close market shares together might provide information more efficiently.
Step 0: Lab Preparation
- Please review Lecture 11
- Git Branches
- Only for reference: Yahoo Finance REST format
- Only for reference: Partitioning a Square into Rectangles: NP-Completeness and Approximation Algorithms
Step 1: Source Code
- Clone your private repo to an appropriate directory in your home folder
(
~/labsis a good choice):$ git clone git@github.com:williams-cs/<git-username>-cs135-lab4.git
Remember, you can always get the repo address by using the ssh copy-to-clipboard link on github. - Once inside your <git-username>-cs135-lab4 directory, create a virtual environment using
$ virtualenv -p python3 venv
- Activate your environment by typing:
$ . venv/bin/activate
- Use pip to install the pillows imaging library:
$ pip install pillow
- Use pip to install the requests HTTP library:
$ pip install requests
- Remember that you must always activate your virtual environment when opening a new terminal
- This week we will use another feature of Git: branches. Branches allow you to make local changes to your repo without destroying the master branch. They facilitiate parallel workflows and development and provide a simple and effective means for concurrent coding
- Type
$ git branch
and notice that you are currently editing the master branch. - Create a new branch with
$ git branch viz
- Checkout this branch by typing
$ git checkout viz
- Any changes you make to the repository are now isolated on this branch.
Step 2: Grabbing Data
The file fetch.py contains skeleton code to download a CSV file containing stock symbols, market capitalization, and price change percentages over a 50 day moving average. Here is how it works.
- The function
nasdaq_top_100grabs some CSV information about the NASDAQ 100 stocks using therequestslibrary, parses it, and returns a list of stock symbols. This function is provided. - The function
from_urltakes a list of stock symbols and constructs a URL to download symbol, market cap, and percentage change data in CSV format. Here is an example URL to grab information about Apple, Google, and Facebook. The f parameter in the URL asks for data about the stock symbol (s), the market cap (j1) and the percentage change in the 50-day moving average (m8)http://download.finance.yahoo.com/d/quotes.csv?s=AAPL,GOOG,FB&f=sj1m8
You need to write the function so it returns the appropriately formatted URL. In other words, you'll return the above string, but with the correct stock symbols inserted and formatted properly. - The
mainfunction is provided. It grabs the CSV file from the URL that you built and prints it to striaght to standard out. - Running
$ python3 fetch.py
will print out this data in CSV format to the terminal. You can (and should) redirect this output to a file by typing$ python3 fetch.py > data.csv
- The first few lines of the data should look similar to this:
      "ATVI",16.721B,+6.93%
      "ADBE",39.800B,+8.04%
Step 3: Scrubbing Data
-
The file
stocks.pycontains a function calledstock_info_fromthat takes a filename in CSV format and returns a list of triples where each triple is a stock symbol, market cap, and percentage increase. - You should open the file using the
withsyntax and make use of acsv.readerto parse the CSV - You will need to massage the market cap and percentage data as described in the docstring. You might find it helpful to define two helper functions
to_billionandto_percentinside the definition ofstock_info_from - The stocks should be sorted by market cap. To do this, make sure to read up on using the key parameter to the sort method along with the operator.itemgetter function. Also, remember that sorting is a side-effecting operation on lists; it does not return a new list
      def stock_info_from(file):
          """
          Takes a CSV file of the form

          STOCK_SYMBOL, MARKET_CAP, PERCENT_CHANGE_50_DAYS

          where

          STOCK_SYMBOL is a string
          MARKET_CAP is a string of the form "XX.XXXB" where B = BILLION
          PERCENT_CHANGE_50_DAYS is a string of the form "[+,-]XXX.X%"

          and returns a list of 3-tuples of the form

          (STOCK_SYMBOL, X, Y)

          where

          X is an integer (the actuall billion dollar number) and
          Y is a float where -20.5%  is -0.205

          sorted by market cap lowest-to-highest"""
Make sure to test your function out from the Python REPL. Your data should look similar to the following.
  >>> import stocks
  >>> stocks.stock_info_from("data.csv")
  [('LVNTA', 5658000000, 0.0516), ..., ('AAPL', 752200000000, 0.0784)]
  >>>
Step 4: Making Rectangles
Recall from Lecture 11 that given a list of areas A = [A0, ..., An-1] that sum to 1, we can produce, through dynamic programming, a partition P = [0, p1, ..., pq, n-1] of A into q columns of rectangles that tiles the unit square and minimizes the sum of the rectangle perimeters. Each consecutive pair of numbers in P should be viewed as slicing A into a column of rectangles where the column width is equal to the sum of the areas in that column. That is, for any consecutive pi, pi+1 in P, the areas Api,...,Api+1 all appear in the i+1 column. The width of that column is Api+ ... + Api+1
This functionality is available in the table module through the function min_partition.
Here is an example. Suppose that I have a list of 8 areas A, which yields a partition part = [0, 4, 6, 8] when using the table.min_partition function.
    >>> A = [0.02,0.04,0.06,0.08,0.2,0.2,0.2,0.2]
    >>> part = table.min_partition(A)
    >>> part
    [0, 4, 6, 8]
This means that the first column contains rectangles with areas 0.02, 0.04, 0.06, and 0.08, the second column contains rectangles with areas 0.2 and 0.2, and the third column also contains rectangles with areas 0.2 and 0.2. The first column has width 0.02+0.04+0.06+0.08=0.2 while the remaining columns each have width 0.2+0.2=0.4. The first rectangle in the first column has top-left and bottom-right coordinates respectively (0, 0), (0.2, 0.1)) because 0.02 is 1/10 the area of the four rectangles appearing in the first column.
Here's a picture of the tiling of the unit square.

Implement the function partition_to_rects.
    def partition_to_rects(part, areas):
        """
        return a list of rectangles, one per area, that partition
        the unit square in corresondence to 'part'

        :param part: a partition of areas of the form [0, p1, p2, ..., N]
        :param areas: a list of N areas where the sum of the areas is 1.0"""
You can test your code with the following
    >>> partition_to_rects(part, [0.02,0.04,0.06,0.08,0.2,0.2,0.2,0.2])
    [((0, 0), (0.2, 0.09999999999999999)),
     ((0, 0.09999999999999999), (0.2, 0.3)),
     ((0, 0.3), (0.2, 0.6)),
     ((0, 0.6), (0.2, 1.0)),
     ((0.2, 0), (0.6000000000000001, 0.5)),
     ((0.2, 0.5), (0.6000000000000001, 1.0)),
     ((0.6000000000000001, 0), (1.0, 0.5)),
     ((0.6000000000000001, 0.5), (1.0, 1.0))]
In general, consider the following strategy when implementing your function:
- Construct rectangles one column at a time, starting with the column corresponding to the rectangles with area in the slice A0,...,Ap1.
- The sum of the areas of your slice will give you the proper normalization factor
- Keep track of the top-left corner of the next rectangle-to-generate; update the top-left corner once you've added the new rectangle to the return list
Step 5: Visualizing Rectangles
The draw_rects function takes a square image, a list of N rectangles that collectively tile the unit square, and a list of N colors and draws a projection of each rectangle, filled with the appropriate color, onto the image.
Some notes:
- Image objects have a size attribute that returns a tuple (width,height) so you can always get dimesions from the object.
- Any point (x,y) of the unit square corresponds to the point (x × width, y × height) in your image. Use this to map your rectangles onto the image appropriately.
- The function
draw_symbols(provided) should help inspire your definition ofdraw_rects.
    def draw_rects(im, rects, colors):
        """
        Map and draw rectangles from the unit square onto the image

        :param im: an Image
        :param rects: a list of N rectangles where a rectangle is a pair of points
        :param symbols:  a list of N stock symbols corresponding to the N rectangles"""
Step 6: Putting it all Together
The function draw should perform the following:
- Create a list of N areas that correspond to the market capitalization of the stocks, suitably normalized. Consider using
sumto find the total market capitalization. - Use
table.min_partitionto get an optimal column partition of the N areas. - Use
partition_to_rectsto compute the N rectangles that tile the unit square and correspond to the given parition. - Generate a list of N colors using the
create_colorfunction. - Use
draw_rectsand thendraw_symbolsto create the final image.
To run your code from the command line use
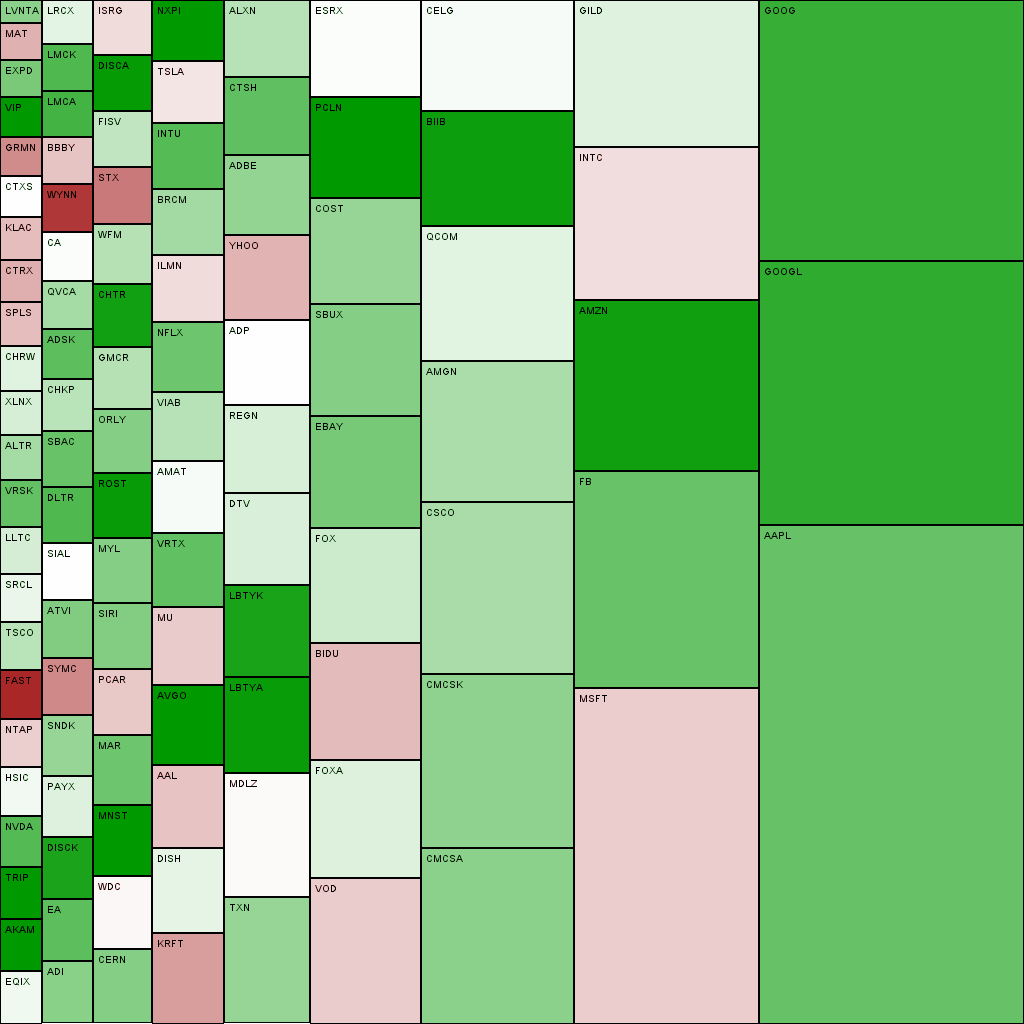
$ python3 stocks.py data.csv stocks.png 1024 1024
Your visualization should look like this.
Step 7: Submission
- Now commit those additions to the repository:
$ git commit -a -m "some log message"
- Push your changes back to github repo:
$ git push
You will probably be asked to type$ git push --set-upstream origin vizwhich you should do. This pushes your viz branch back up to the GitHub Repo. - Now navigate to your GitHub repo using a web browser. You should see a list of recently pushed branches with links to compare and pull request. Go ahead and issue a PR